
Using Satellite Imagery to Understand Tropical Cyclones
Satellite imagery can be used to gauge the intensity and tropical characteristics of tropical cyclones. As seen in previous lessons, satellite imagery can show when a tropical cyclone is undergoing an eyewall replacement cycle, developing a strong eye, and give an estimate of the intensity of the winds within a tropical cyclone. The most common satellite imagery for viewing tropical cyclones is the clean longwave infrared band, which shows the cold cloud tops, the relatively warm eye, and structure within a tropical cyclone. The clean IR band also does not rely on sunlight to be visible such that it can be used 24 hours a day.
Dvorak Technique
Satellite imagery can be used to estimate the intensity of a tropical cyclone at any point during its life cycle, especially in the days before Hurricane Hunter aircraft were used. The process for using satellite imagery to estimate tropical cyclone intensity is called the Dvorak technique. The Dvorak technique takes into account the structure of the tropical cyclone in terms of the eye, the eyewall, and the outer rainbands. One way to estimate tropical cyclone intensity is by assessing the central dense overcast, or CDO. The CDO shows the large area of thunderstorms surrounding the center of circulation around the tropical cyclone. Mature tropical cyclones will exhibit a large, strong CDO of cool cloud tops surrounding the eye.
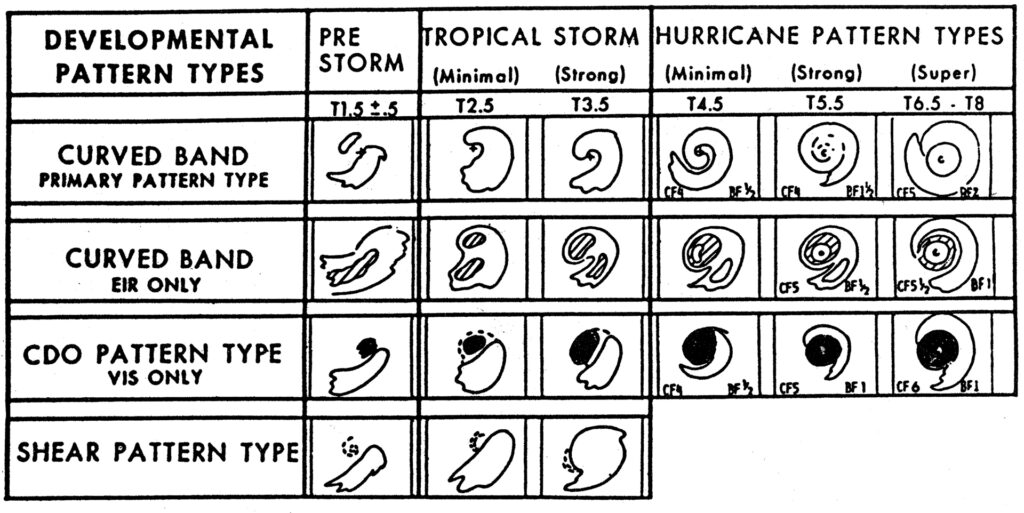
The above image uses drawings of common tropical cyclones on satellite imagery to assess what the strongest wind speeds may be within the tropical cyclone. The Dvorak technique takes into account the CDO of the tropical cyclone and the development of a well-defined eye and eyewall. The T2.5, T3.5, et cetera, refer to the estimated intensity of the storm, with T4.5 and above representing hurricane-strength winds.
Mesovorticies
Satellite imagery can indicate whether a mature tropical cyclone has multiple mesovorticies within the eye and eyewall. These mesovorticies represent small-scale circulations developing in the eyewall, which may result in locally stronger wind speeds within the mesovorticies. Mesovorticies can be detected on satellite imagery and radar by observing that the eye and eyewall are not perfectly round over time.
The clean IR satellite imagery above shows Hurricane Harvey during landfall with mesovorticies occurring within the eyewall. Note how the eye is not perfectly symmetric, which shows the mesovorticies occurring. This may result in locally strong wind gusts within the mesovortex.
The radar imagery above shows ongoing mesovorticies from Hurricane Harvey. Note that there appear to be four mesovorticies occurring in this radar imagery, which would correspond to a wavenumber of four. Wavenumber simply refers to the number of mesovorticies within a tropical cyclone. If the eye were perfectly symmetric with no ongoing mesovorticies, then the wavenumber would be zero.
Diurnal Maximum (DMax)
Satellite imagery is also useful for showing the diurnal maximum intensity of tropical cyclones. The diurnal maximum, or DMax, in convective intensity occurs overnight within tropical cyclones because the ocean stays relatively warm while the atmosphere cools overnight. The cloud tops of the tropical cyclone will become colder, representing more intense convection. This increased convection overnight may be a precursor to rapid intensification, during which wind speeds of a tropical cyclone significantly increase. Rapid intensification is defined as an increase in wind speeds of 30 knots or greater over a 24 hour period.