
Surface – Dew Point Temperature
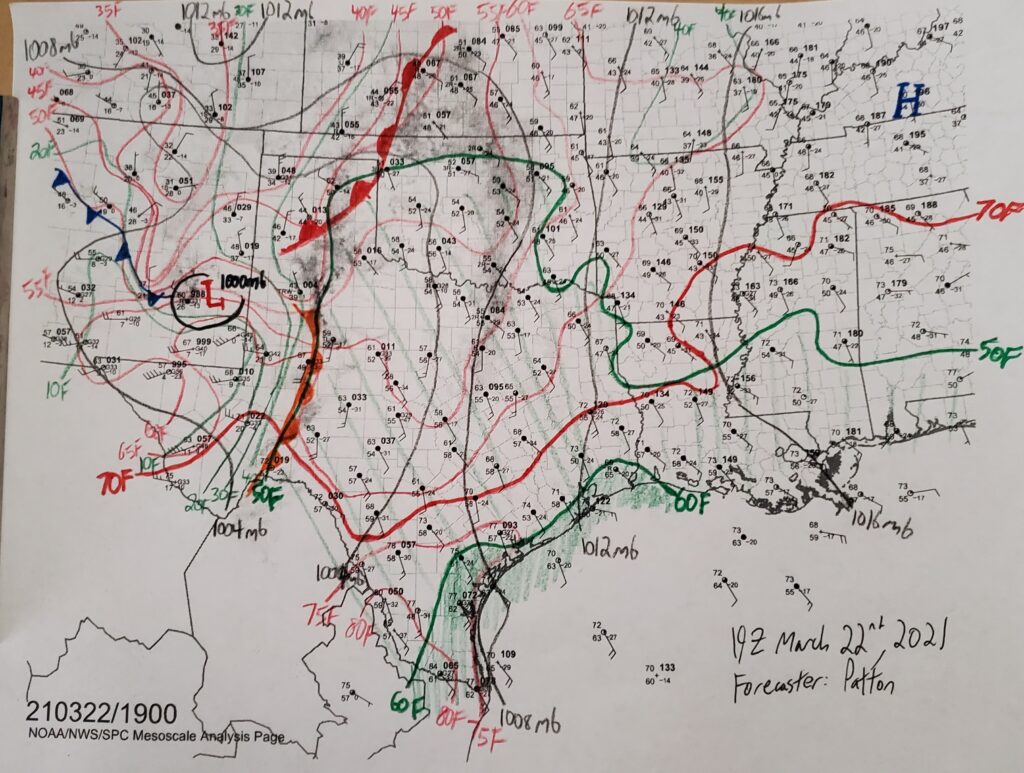
Lines of constant dew point temperature are plotted on surface analyses with solid green lines. These dew point temperature contours can be drawn every five or ten degrees Fahrenheit, depending on the situation. In the above example, dew point temperature lines are drawn every ten degrees Fahrenheit because there is a significant mass of dry air in the southwest region of this map. The areas representing higher moisture values above 50F and above 60F are shaded green in this example to represent the moist air mass. The moisture values which are shaded change depending on the dew point temperatures which are present. For instance, if the highest dew point temperature was only in the upper 40s, then it may be appropriate to only shade dew point temperatures above 40F. This moisture is a key component of severe thunderstorm formation.
The contours for dew point temperature should never cross the contours for the air temperature for a specific temperature value. If they did, this would imply a dew point temperature which is higher than the air temperature which is not usually physically possible. For example, the 50F dew point temperature should never cross the 50F air temperature line, however, it can cross lines of temperatures higher than 50F because that would still be less than 100% saturation. At 100% saturation, where the dew point temperature is equal to the air temperature, precipitation would occur, which would prevent saturation values over 100% (i.e., this would prevent the dew point temperature from being higher than the air temperature).
Determining the Dew Point Temperature from the Station Plot
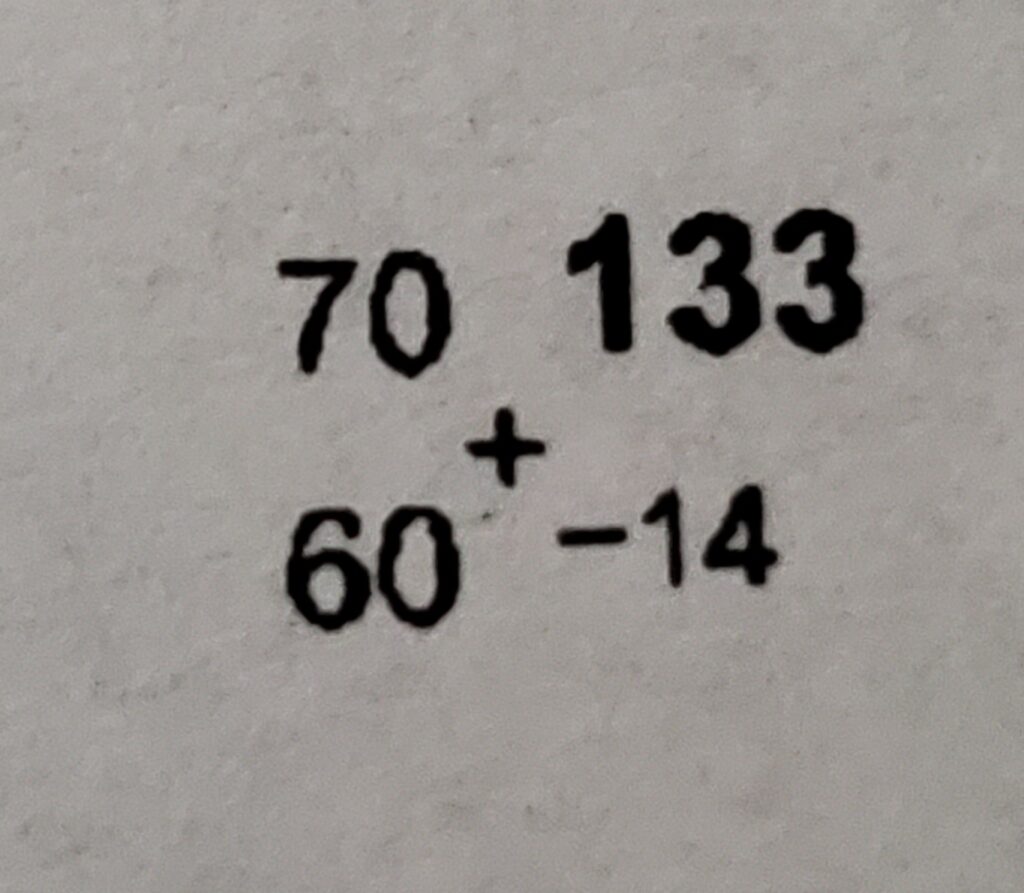
The surface dew point temperature will always be written in the bottom left corner of the station plot. From the station plot in the above example, the recorded surface dew point temperature is 60 degrees Fahrenheit (60F).