
Surface – Fronts
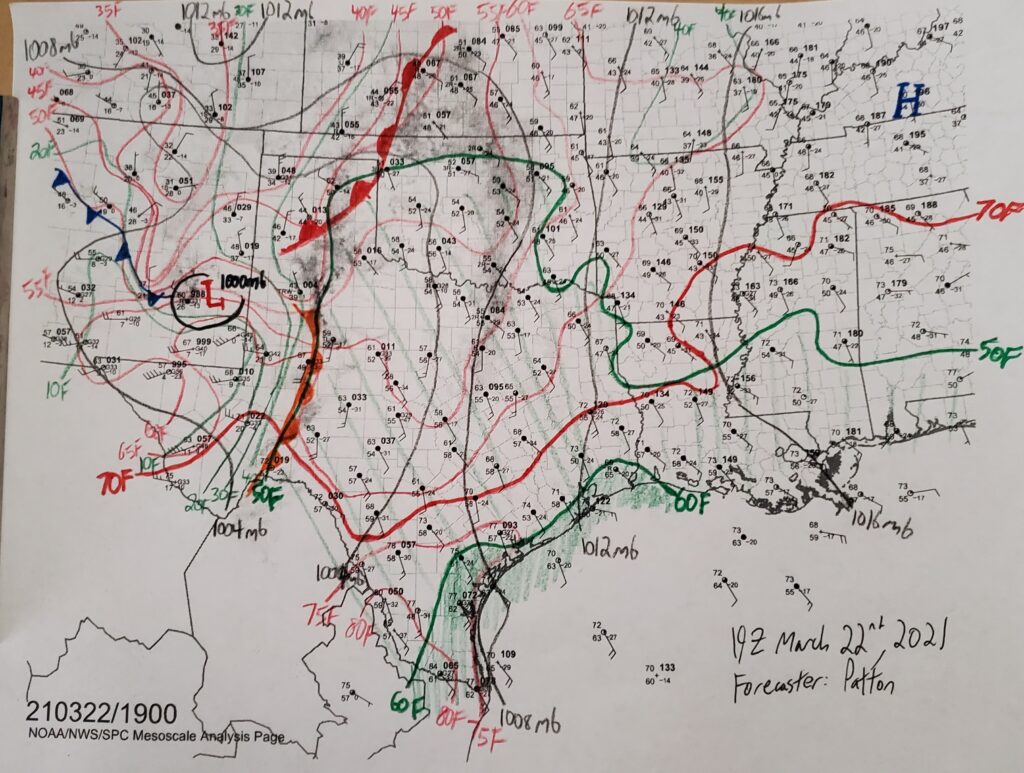
Fronts should be the last thing drawn on a surface analysis, as they depend on understanding how pressure, temperature, and dew point temperature are all changing across different air masses. As discussed in the intro lesson, the surface low pressure (denoted with the large red L) is often the center-point for surface fronts. Warm fronts should be drawn with a bold red line between advancing warm air and the cooler air into which it is advancing, and vice versa for cold fronts with a bold blue line. The icons representing the direction of motion for the front (red semicircles for warm fronts, blue triangles for cold fronts, orange semicircles for dry lines) should be drawn on the side of the front in the direction in which the front is moving. For example, in the above image, the warm front extending from the Texas panhandle into central Kansas is generally advancing towards the northwest as the winds behind the front are coming from the southeast. Likewise, for the dry line in western Texas, the winds behind the dry line are coming from the west or southwest, so the orange semicircles are drawn on the eastern side of the dry line as that is the direction in which the dry line is advancing.