
Surface – Pressure
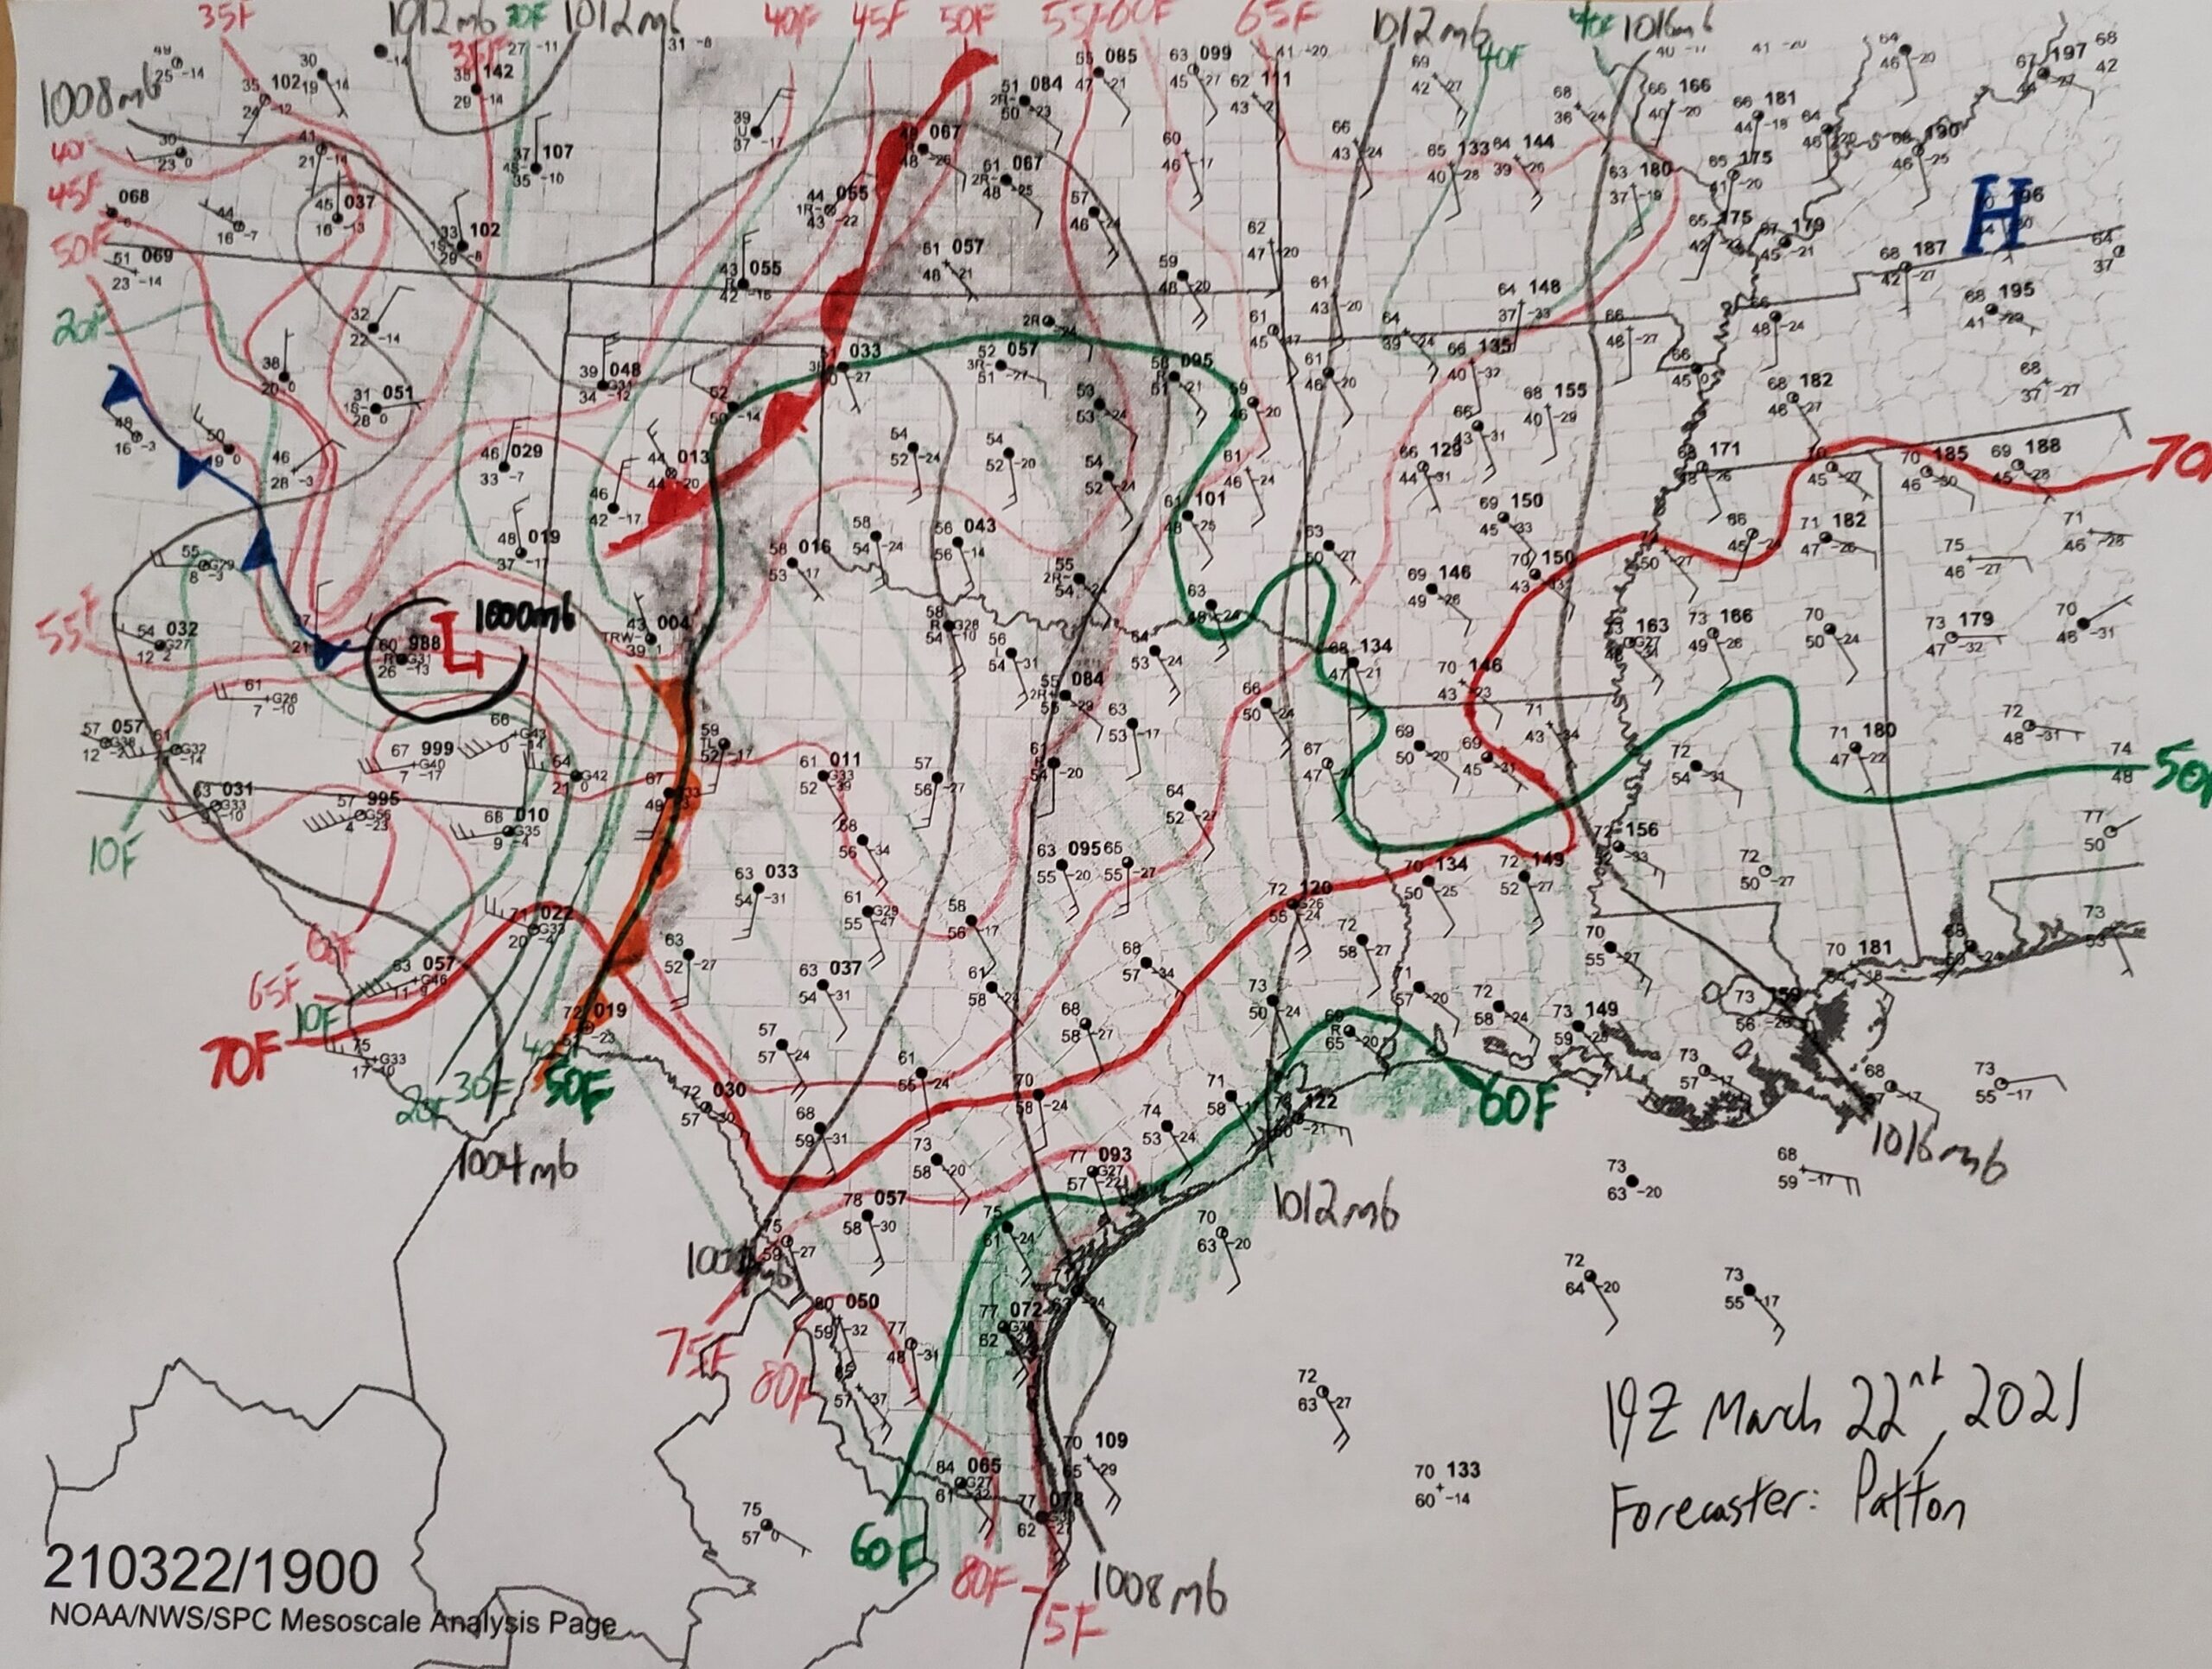
The pressure lines, or contours, on surface analysis maps are typically drawn in black. The interval between lines of constant pressure (the number of millibars between each drawn pressure contour) should be four millibars, such that every four millibars in change in pressure, a new pressure contour is drawn. The pressure contours should be drawn on multiples of four millibars (i.e., 996 millibars, 1000 millibars, 1004 millibars, etc.). A good way to start drawing pressure contours is to find the lowest or highest pressure on the blank surface analysis and begin drawing lines of constant pressure which divide the pressures which are lower and higher than that constant pressure on both sides. For instance, the 1004 millibar pressure contour should be separating pressures which are greater than 1004 millibars on one side from pressures which are less than 1004 millibars on the other side. In this example, a large red L is drawn near the station reporting the lowest MSLP and a large blue H is drawn near the station reporting the highest MSLP. These represent the local low pressure and high pressure in this region.
How to Interpret the Pressure Value
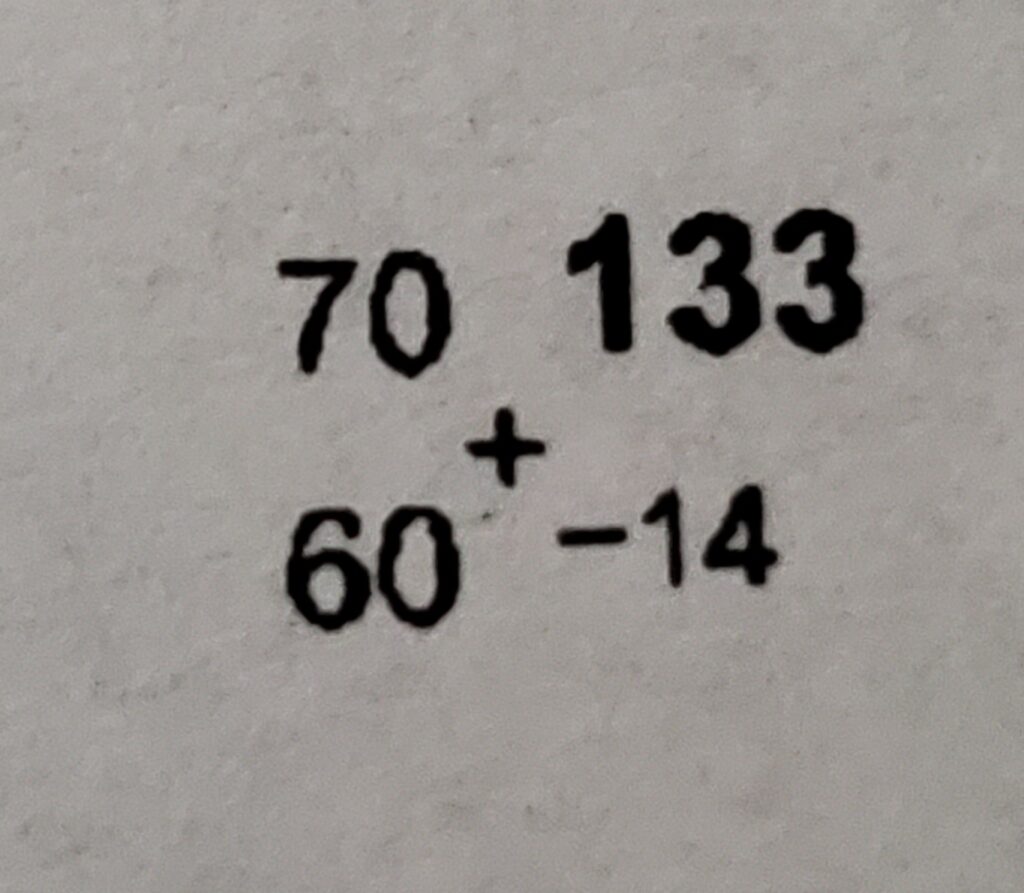
Each station plot includes the MSLP value in the top right corner with a 3 digit bold number. If that 3 digit bold number is less than 500, then put a “10” in front of the number and divide by 10. In the example above, the three digit bold number representing the MSLP measurement is 133. Because this number is less than 500, put a “10” in front of the number and then divide by 10 to get the MSLP value in millibars. This results in the actual MSLP value of 1013.3 millibars. If that three digit bold number is greater than 500, then put a 9 in front of the number and divide by 10. For example, in the larger surface map above, the three digit bold number at the station next to the surface low drawn with the large red L is 988. This represents an MLSP of 998.8 millibars.
The number in the bottom right corner, with either a plus sign or a negative sign in front of it, represents the change in pressure over the last three hours in tenths of millibars. In this example, the MSLP at this station has decreased by 1.4 millibars in the last three hours.